Projects
This page lists all course and side projects I have completed so far.
Viral tweets MLOps

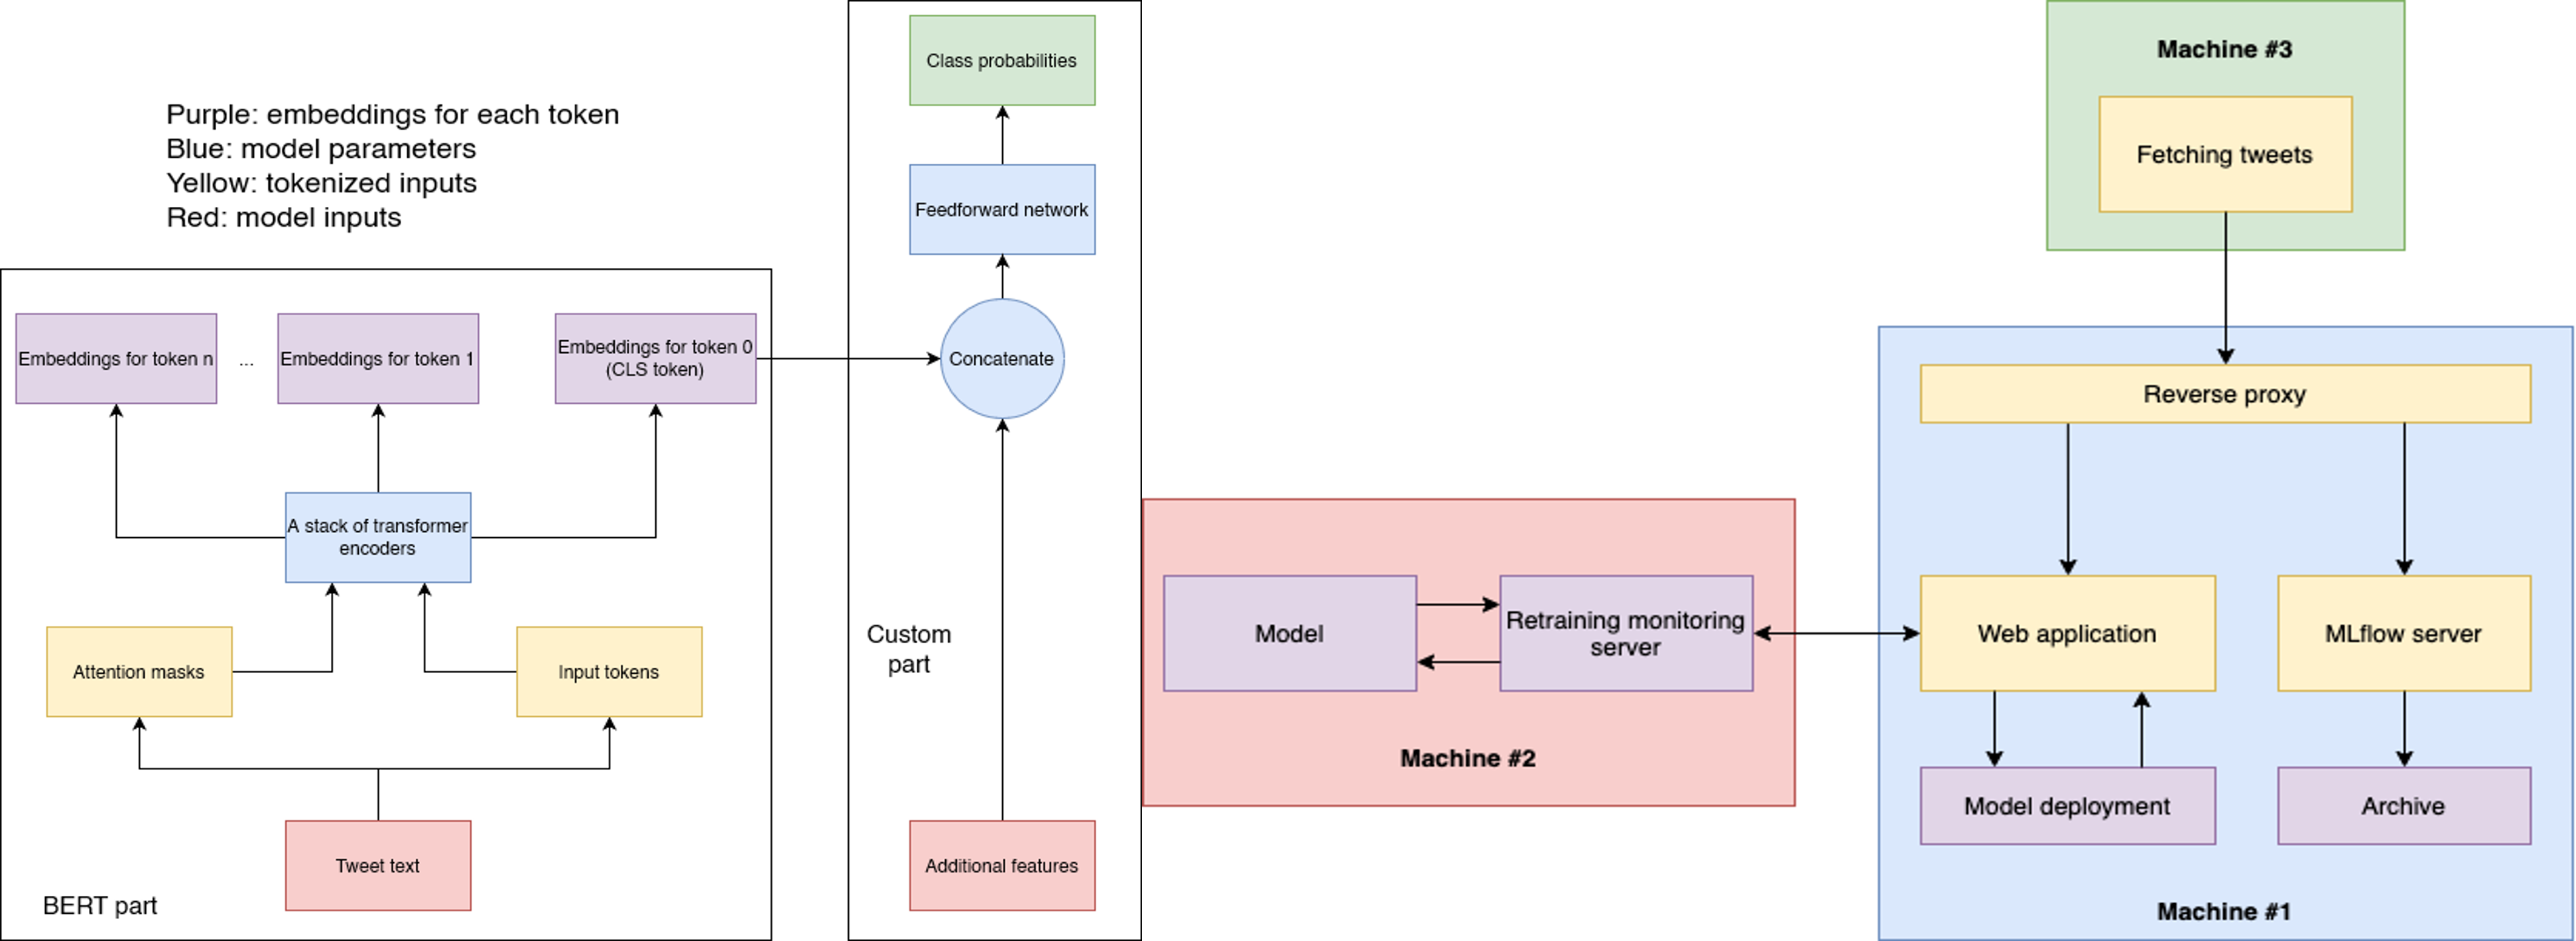
In this project, we build a custom machine learning (ML) pipeline for predicting the virality of Twitter tweets. We scrape a large number of tweets using Twint, perform exploratory data analysis, select a final ML model based on the BERT large language model (achieving 67% on the final train set), and deploy the model on a set of host machines capable of continuously fetching new tweets, retraining the model, and redeploying the model if it performs better than the currently deployed model. This project was completed as a part of a course at Aalto University. The tools we use include PyTorch, HuggingFace Transformers for model development, MLflow for model monitoring, and Flask for model serving and pipeline integration.
My role included helping the group navigate through the project, researching cloud options (GCP), writing PyTorch scripts for data preprocessing and training BERT, and coordinating model development with pipeline development (mainly services related to model training, serving, and monitoring).
GeekLearning

This project implements a Flask web application (dockerized) that takes in an image and determines whether an image looks cartoon, anime, or pokemon. The dataset, consisting of over 100K images, was collated from multiple image sources found on Kaggle or elsewhere. I developed three models with PyTorch:
a support vector machine (linear layer with hinge loss), achieving 72.0% accuracy,
a multilayer perceptron (linear layers with activations between them), achieving 83.9% accuracy,
and a convolutional neural network (finetuning a pre-trained ResNet-50), achieving 97.2% accuracy.
The models and their results were submitted as a course project.
Energy Demand Prediction

This project aims to predict aggregate electricity demand from a selected list of locations in the City of Helsinki by using three leading methods: a classical Box-Jenkins model, a LSTM neural network, and a Facebook Prophet model.
The project itself is divided into 2 parts. The first one is about predicting daily electricity demand using the first 2 models. The second part use Facebook Prophet to do forecasting on hourly demand. The data is fetched from the Nuuka Open API, courtesy of Avoindata.fi.
I was in charge of data collection and preprocessing, exploratory data analysis, including autocorrelation analysis, and developing Prophet models. The best Prophet model achieved 9% mean absolute percentage error, and acceptable residual autocorrelation.
Docs Medium article 1 Medium article 2 GH repo
Bayesian Regression

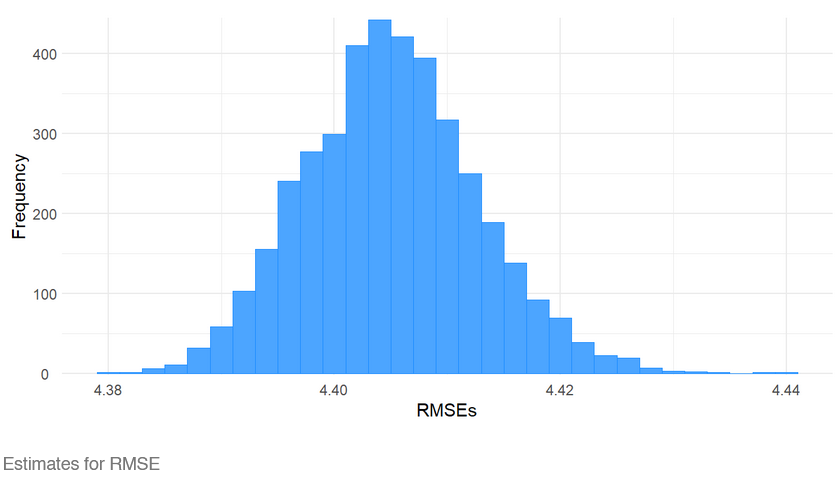
This course project presents a Bayesian workflow on modeling electrical output of a combined cycle power plant. In this project, we implement a linear regression model and a generalized additive model (GAM) using R’s brms package which uses Stan as the backend. It was discovered that the GAM is more suitable to the data than the linear model, indicated by the better performance in posterior predictive checks and approximate leave-one-out cross validation (CV). In particular, we compared the PSIS-LOO CV metric between the models: linear model with a score of -22608, and GAM with a score of -21874.
I was in charge of exploratory data analysis, GAM implementation, and a large chunk of the final report.
Regression App

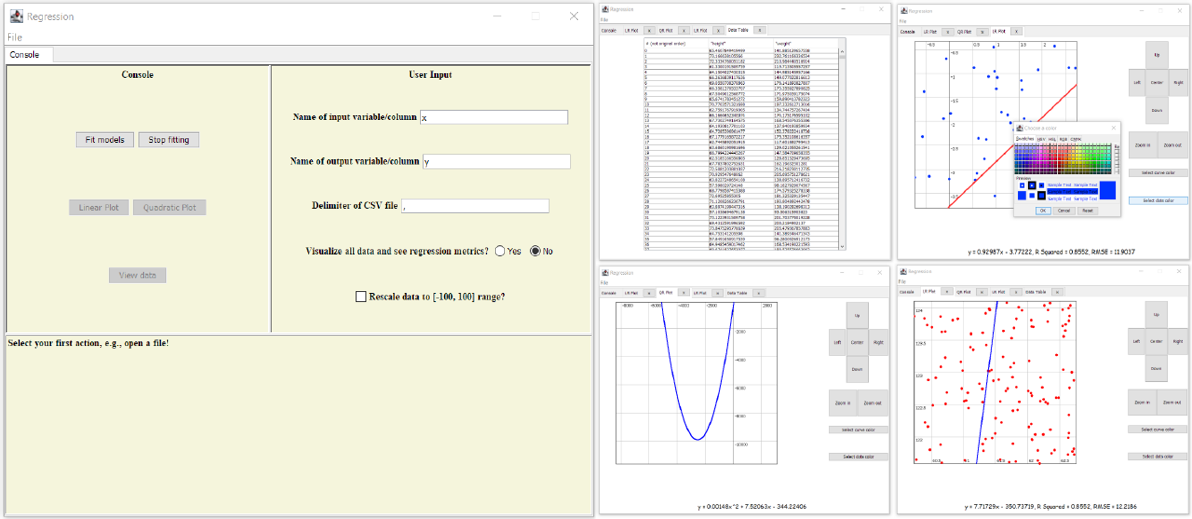
This course project provides a Scala app that fits univariate linear regression and quadratic regression models to any dataset and visualizes the fit along with the data points as a draggable plot. Simple metrics such as coefficient of determination are also displayed. The app can fit models to datasets with hundreds of millions of data points in only a few minutes. While reading a given dataset line by line, the app uses an online, iterative approach to compute necessary statistics (sample variance, covariance) for calculating the model coefficients. Thanks to this method, the data are never loaded into memory (thus reducing memory consumption), and the fitting process can be stopped prematurely, yielding an incomplete model.
Analysis of YouTube Statistics

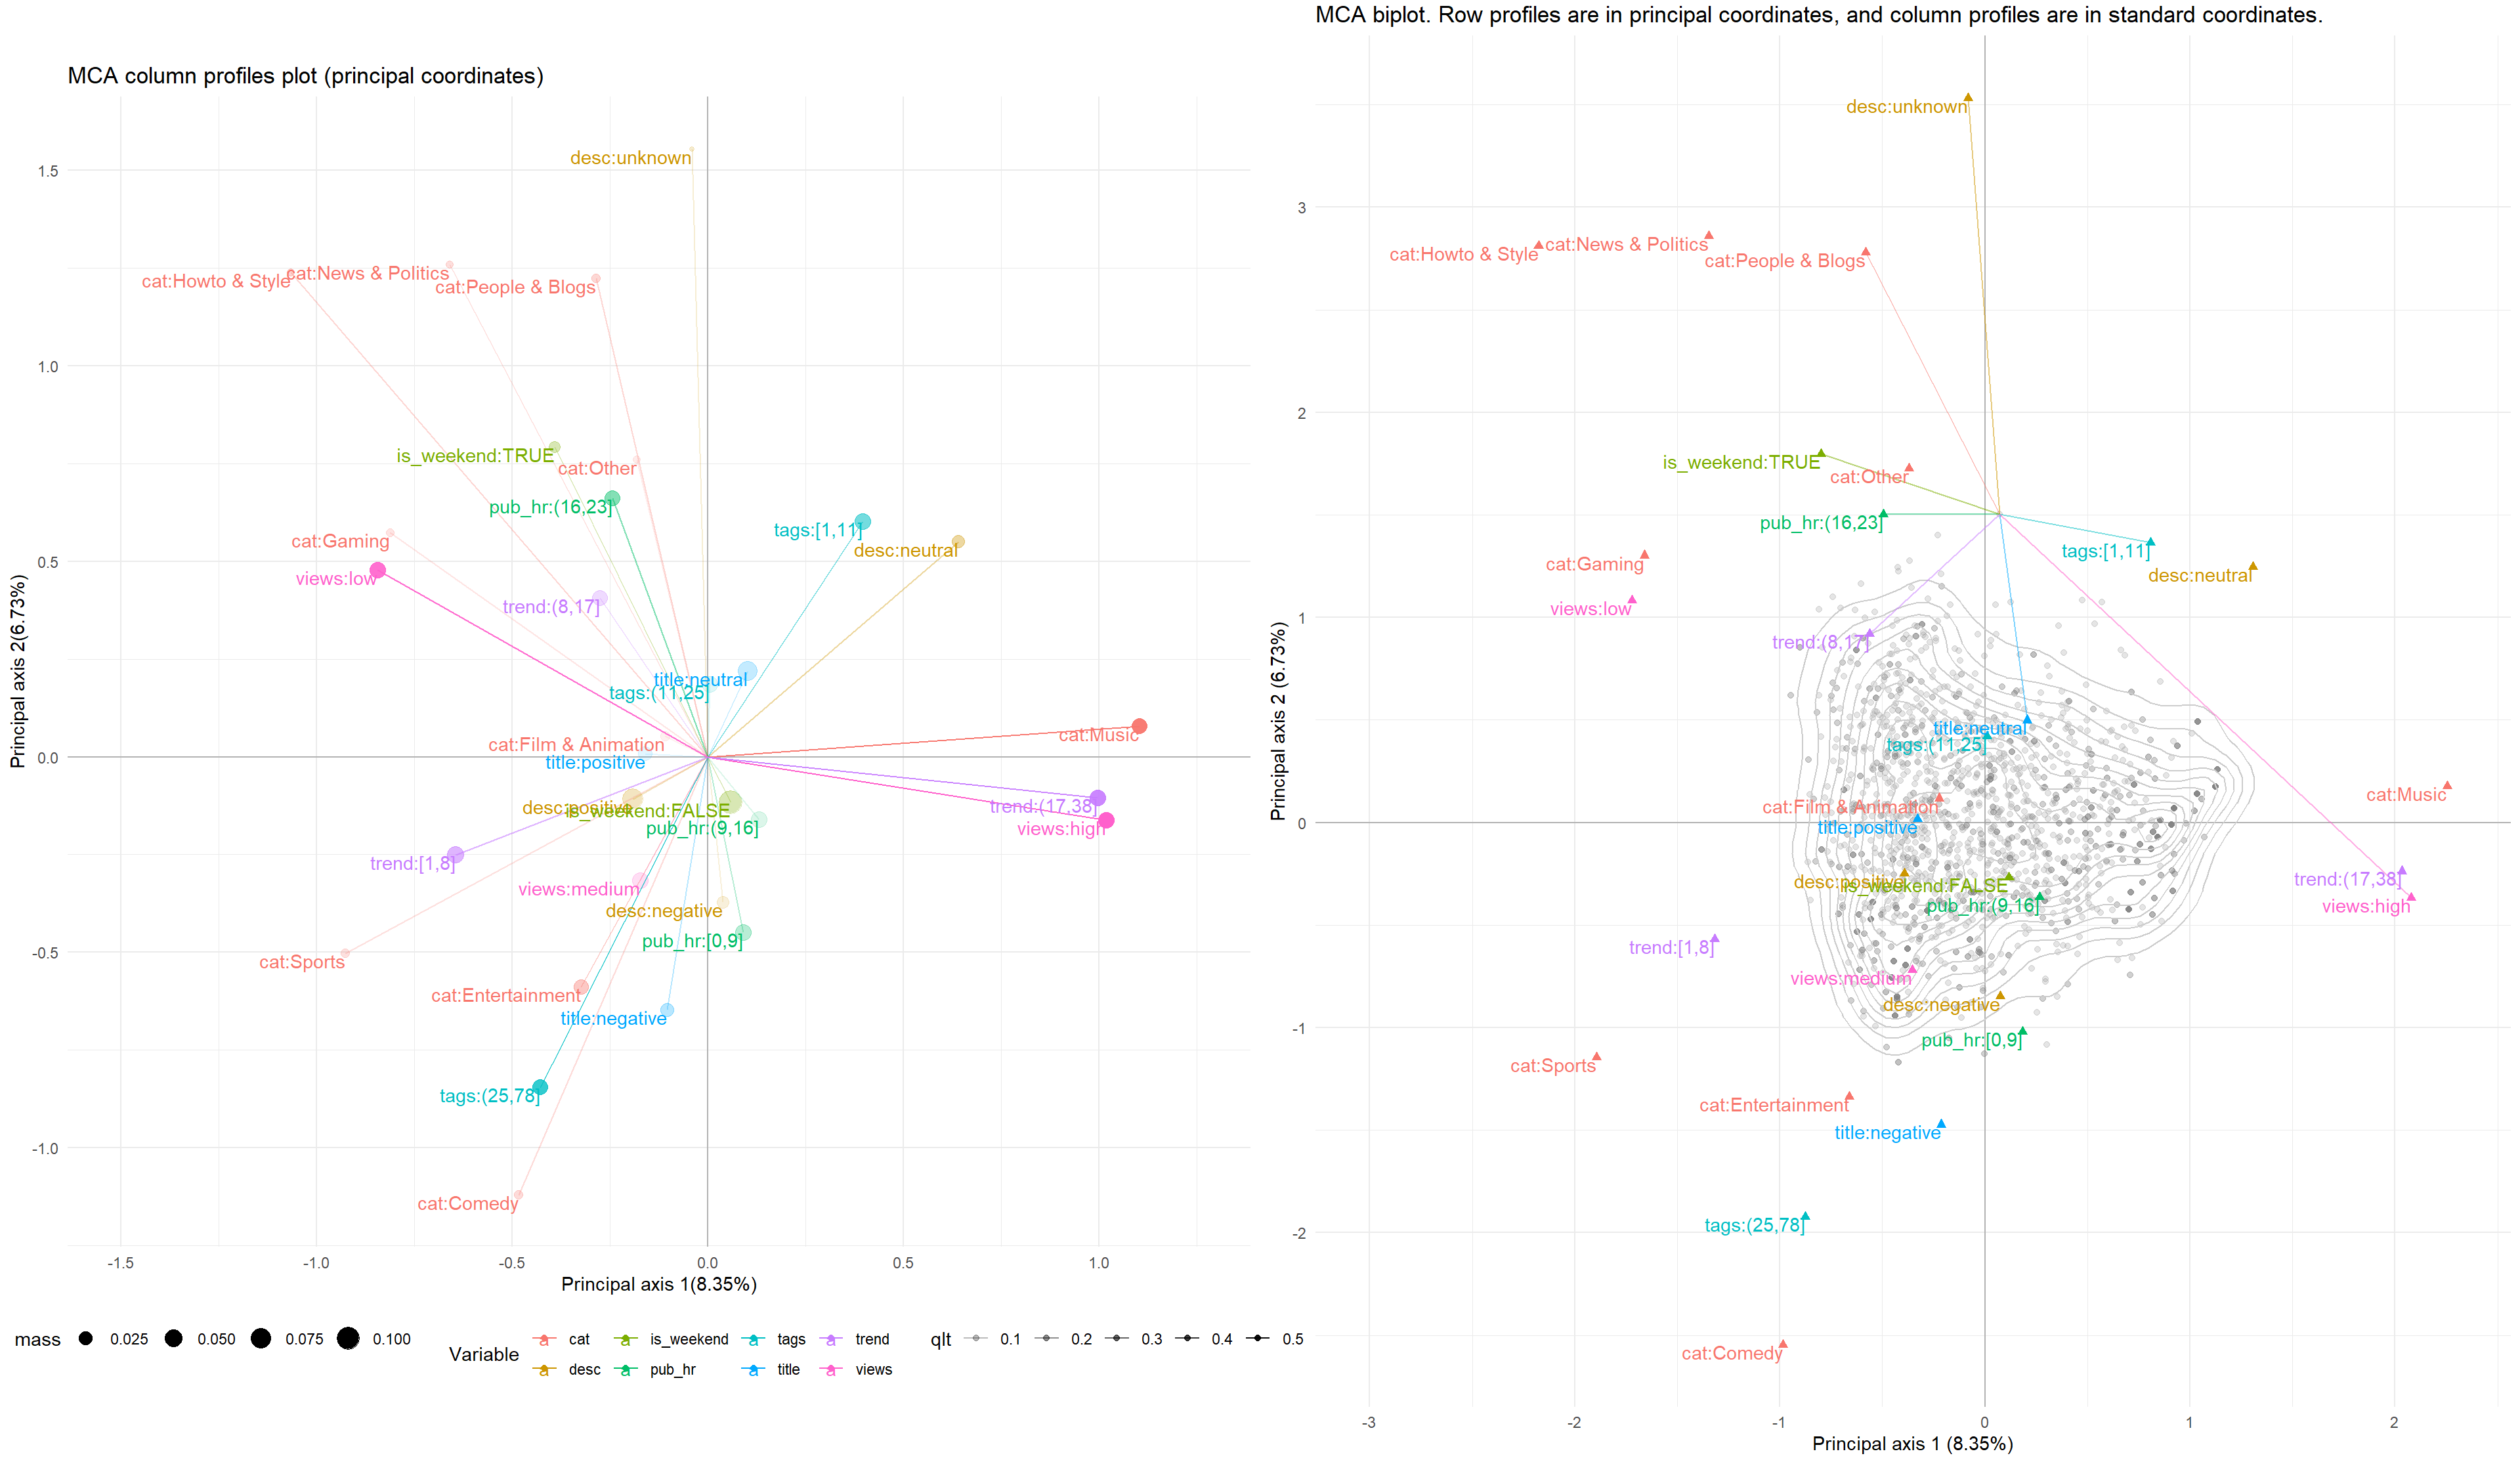
This course project presents univariate, bivariate, and multivariate statistical analyses on a dataset about YouTube videos. The univariate analysis discovered that more than half of the videos have positive descriptions or neutral titles. The bivariate analysis found that the four user interaction variables views, likes, dislikes, and num_cmts have mild to strong positive linear correlations with each other. The principal component analysis was able to summarize the data in few dimensions, and the multiple correspondence analysis found interesting and intuitive relationships between the categorical variables.
